Created for my esteemed network of high-end investors and select members of my private circle, here is a brief snapshot of the key data points shaping NYC's luxury real estate market over the most recent 12 months, curated with intention to remove the clutter and give you a clear sense of the latest shifts and dynamics.
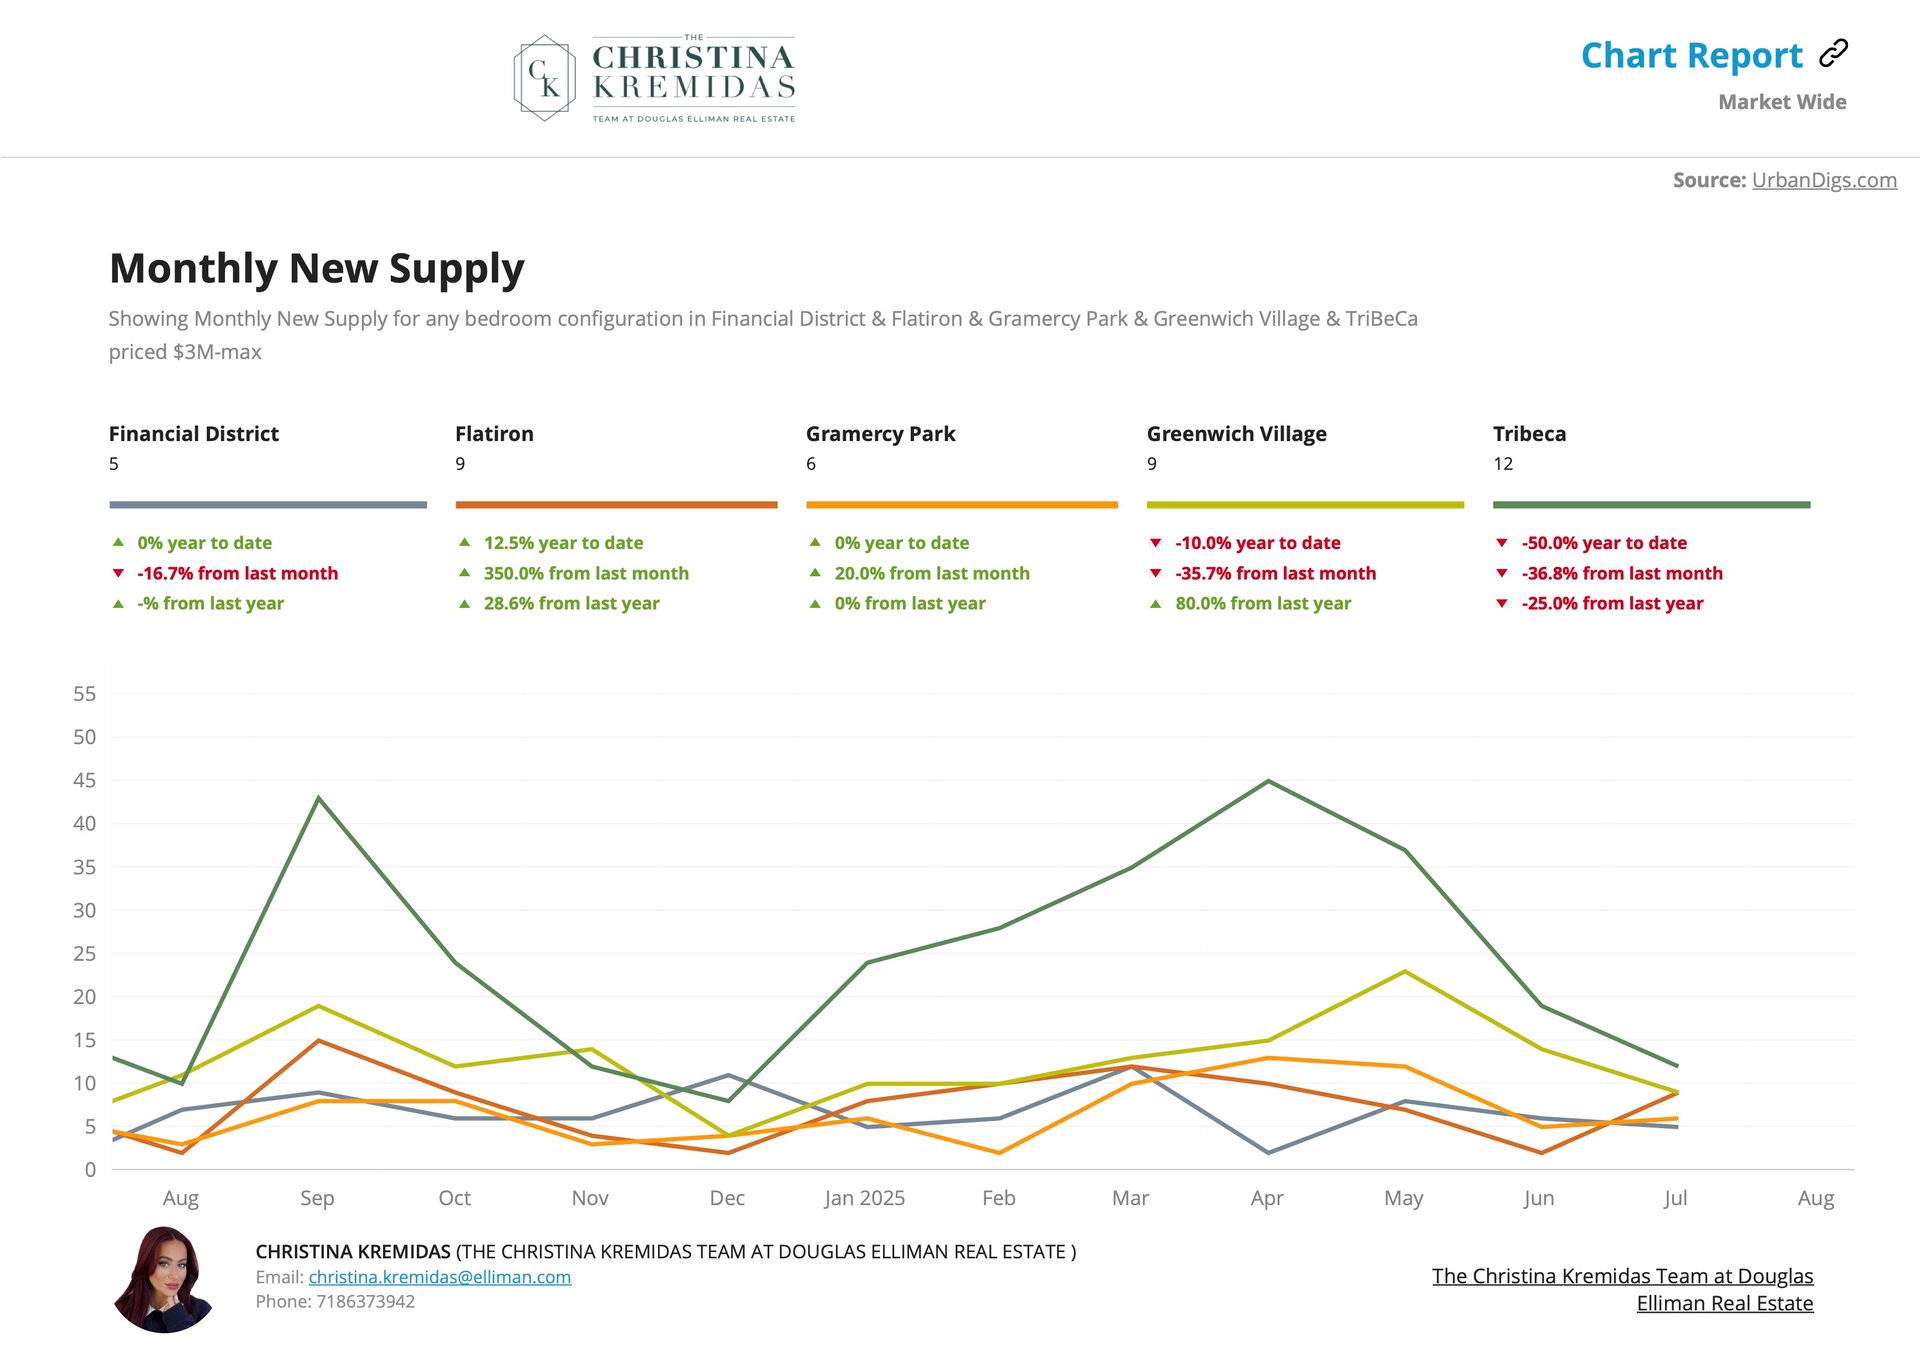
The real pain point this year has been a lack of inventory. Buyers are qualified and ready to do transactions, but our main issue has been finding their ‘dream property.’ In great markets, there are many high-end listings that come on, and they are absorbed by appropriate buyers. The main reasons why my luxury Sellers have been reluctant to list are (1) they are hanging on to properties with 2-3% mortgage interest rates, (2) they simply don’t think they’ll get their desired price at this time, and (3) for those who are staying in the city, they do not think they’ll find a replacement residence that they like.
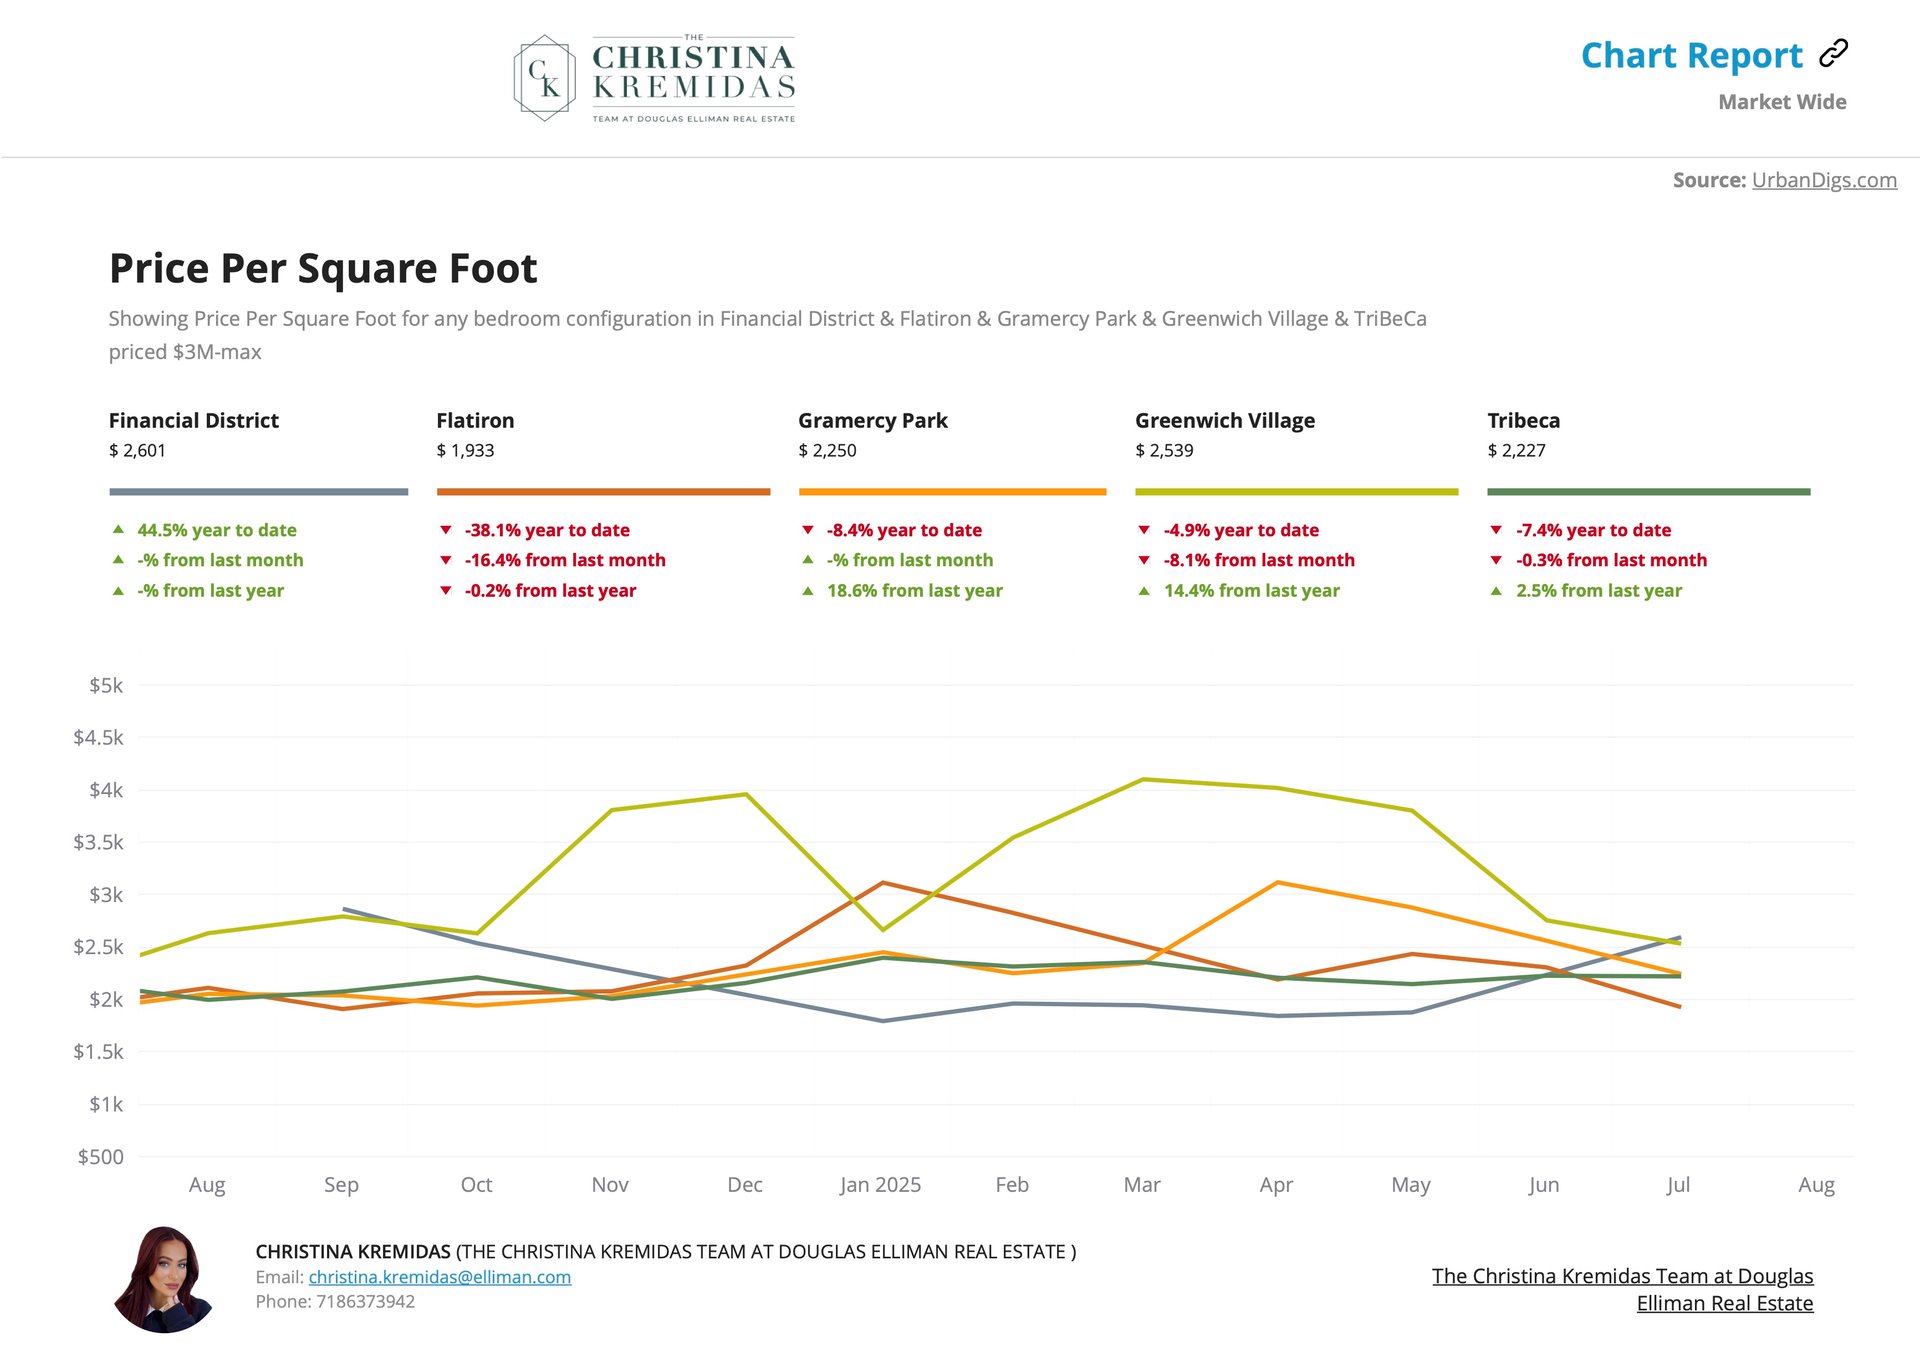
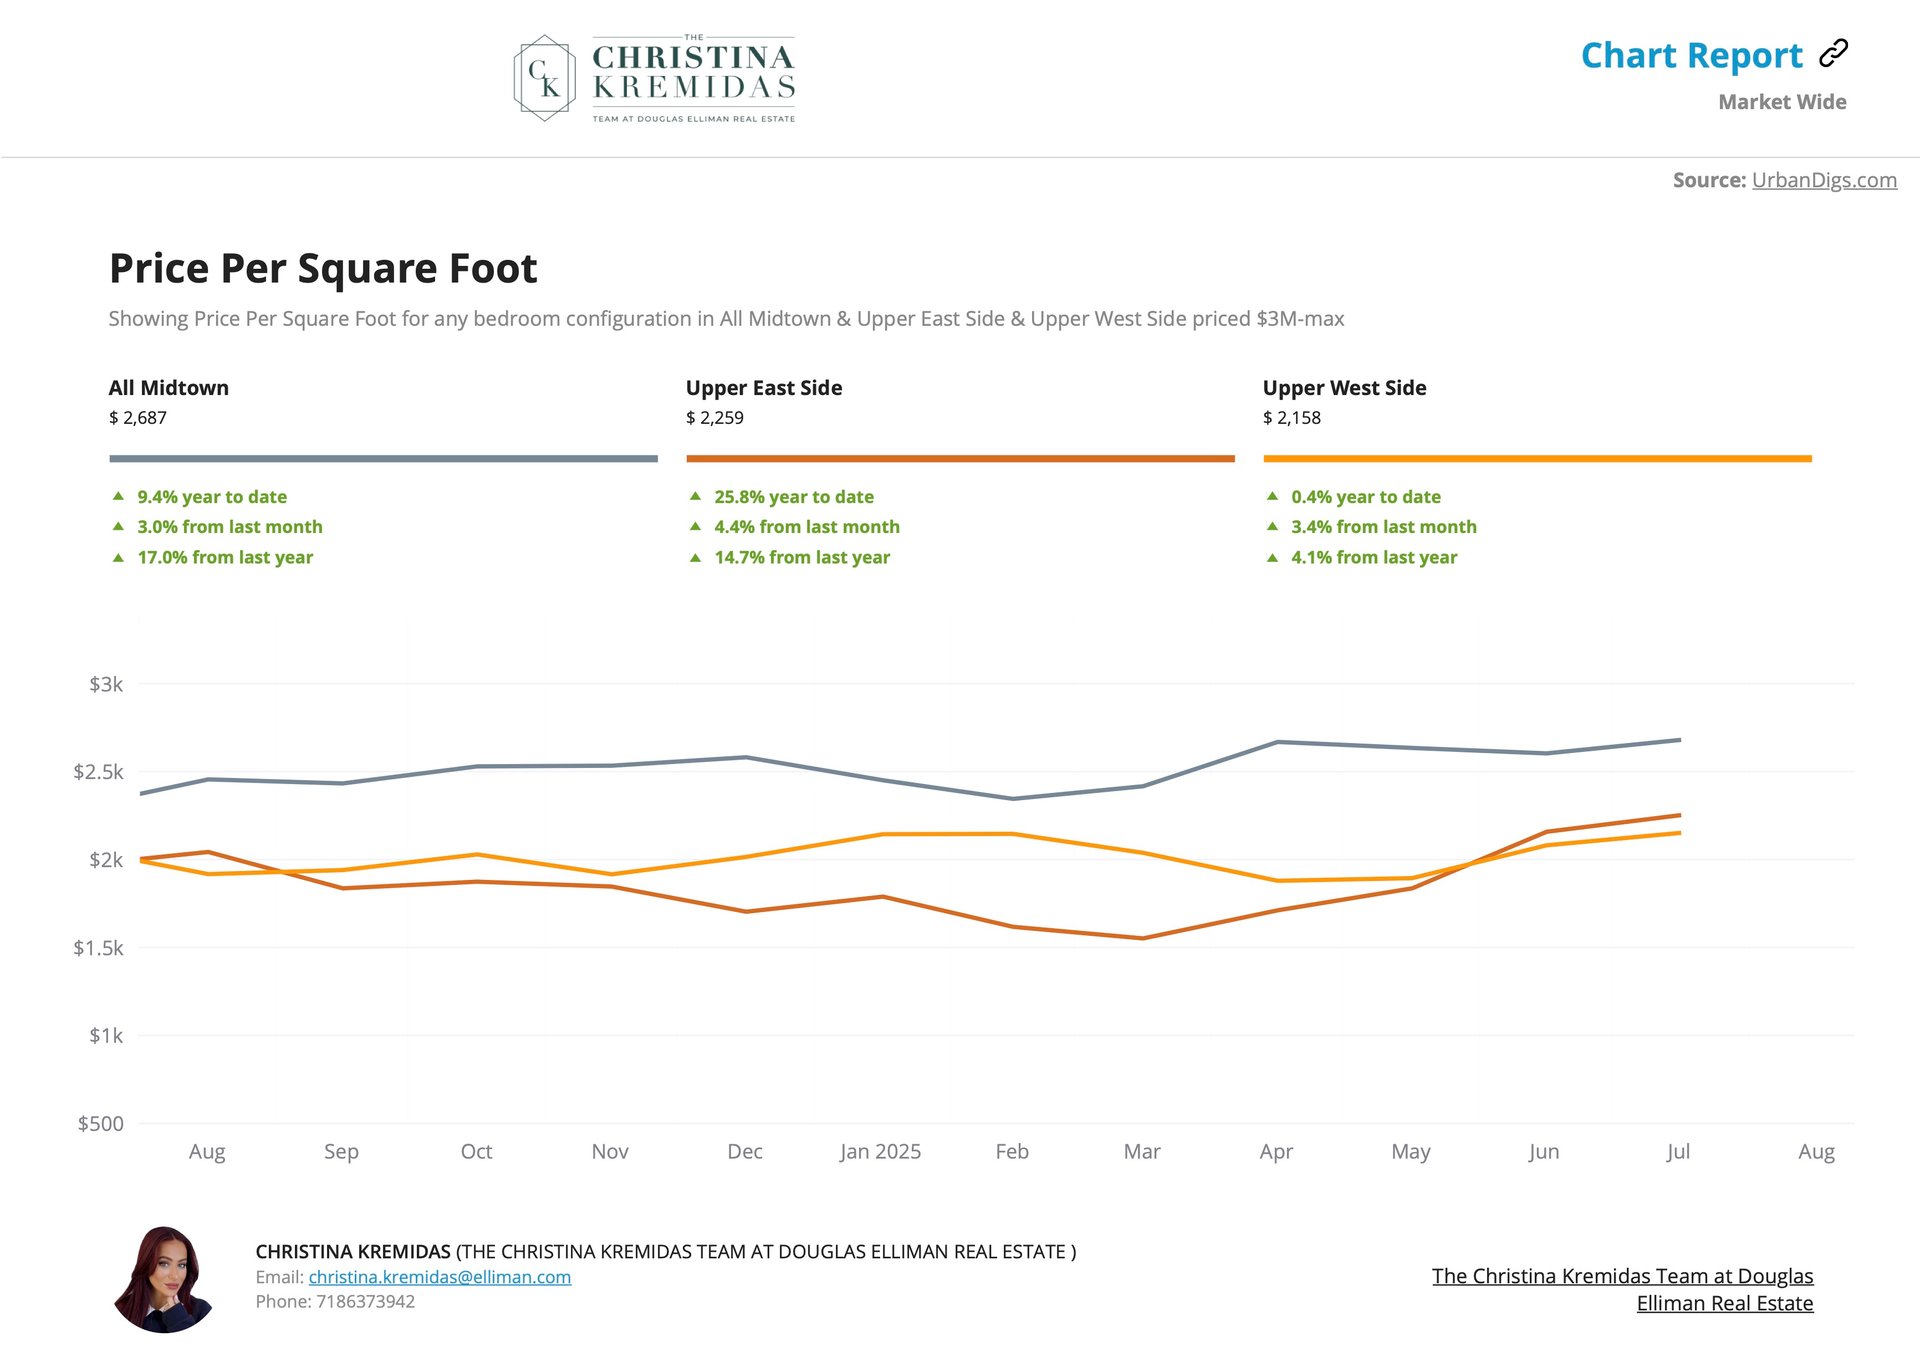
Manhattan’s Midtown and Uptown neighborhoods experienced growth this year across the board, with Midtown experiencing the greatest YoY increase in price per square foot, and the Upper East Side seeing the biggest increase in this figure YTD. This is due to a couple of factors. As workplace culture moves back to in-person, more individuals have chosen to invest in primary residences and pied-a-terres that are close to their offices. These areas are also unceasingly appealing to foreign investors, dignitaries and the like. As supply remained slim, available residences became more competitive.
Have you seen any of the stunning new residential developments uptown? If you haven’t, you really should – many of them have truly outdone expectations. Let me know if you’d like to get out for an exploratory look.
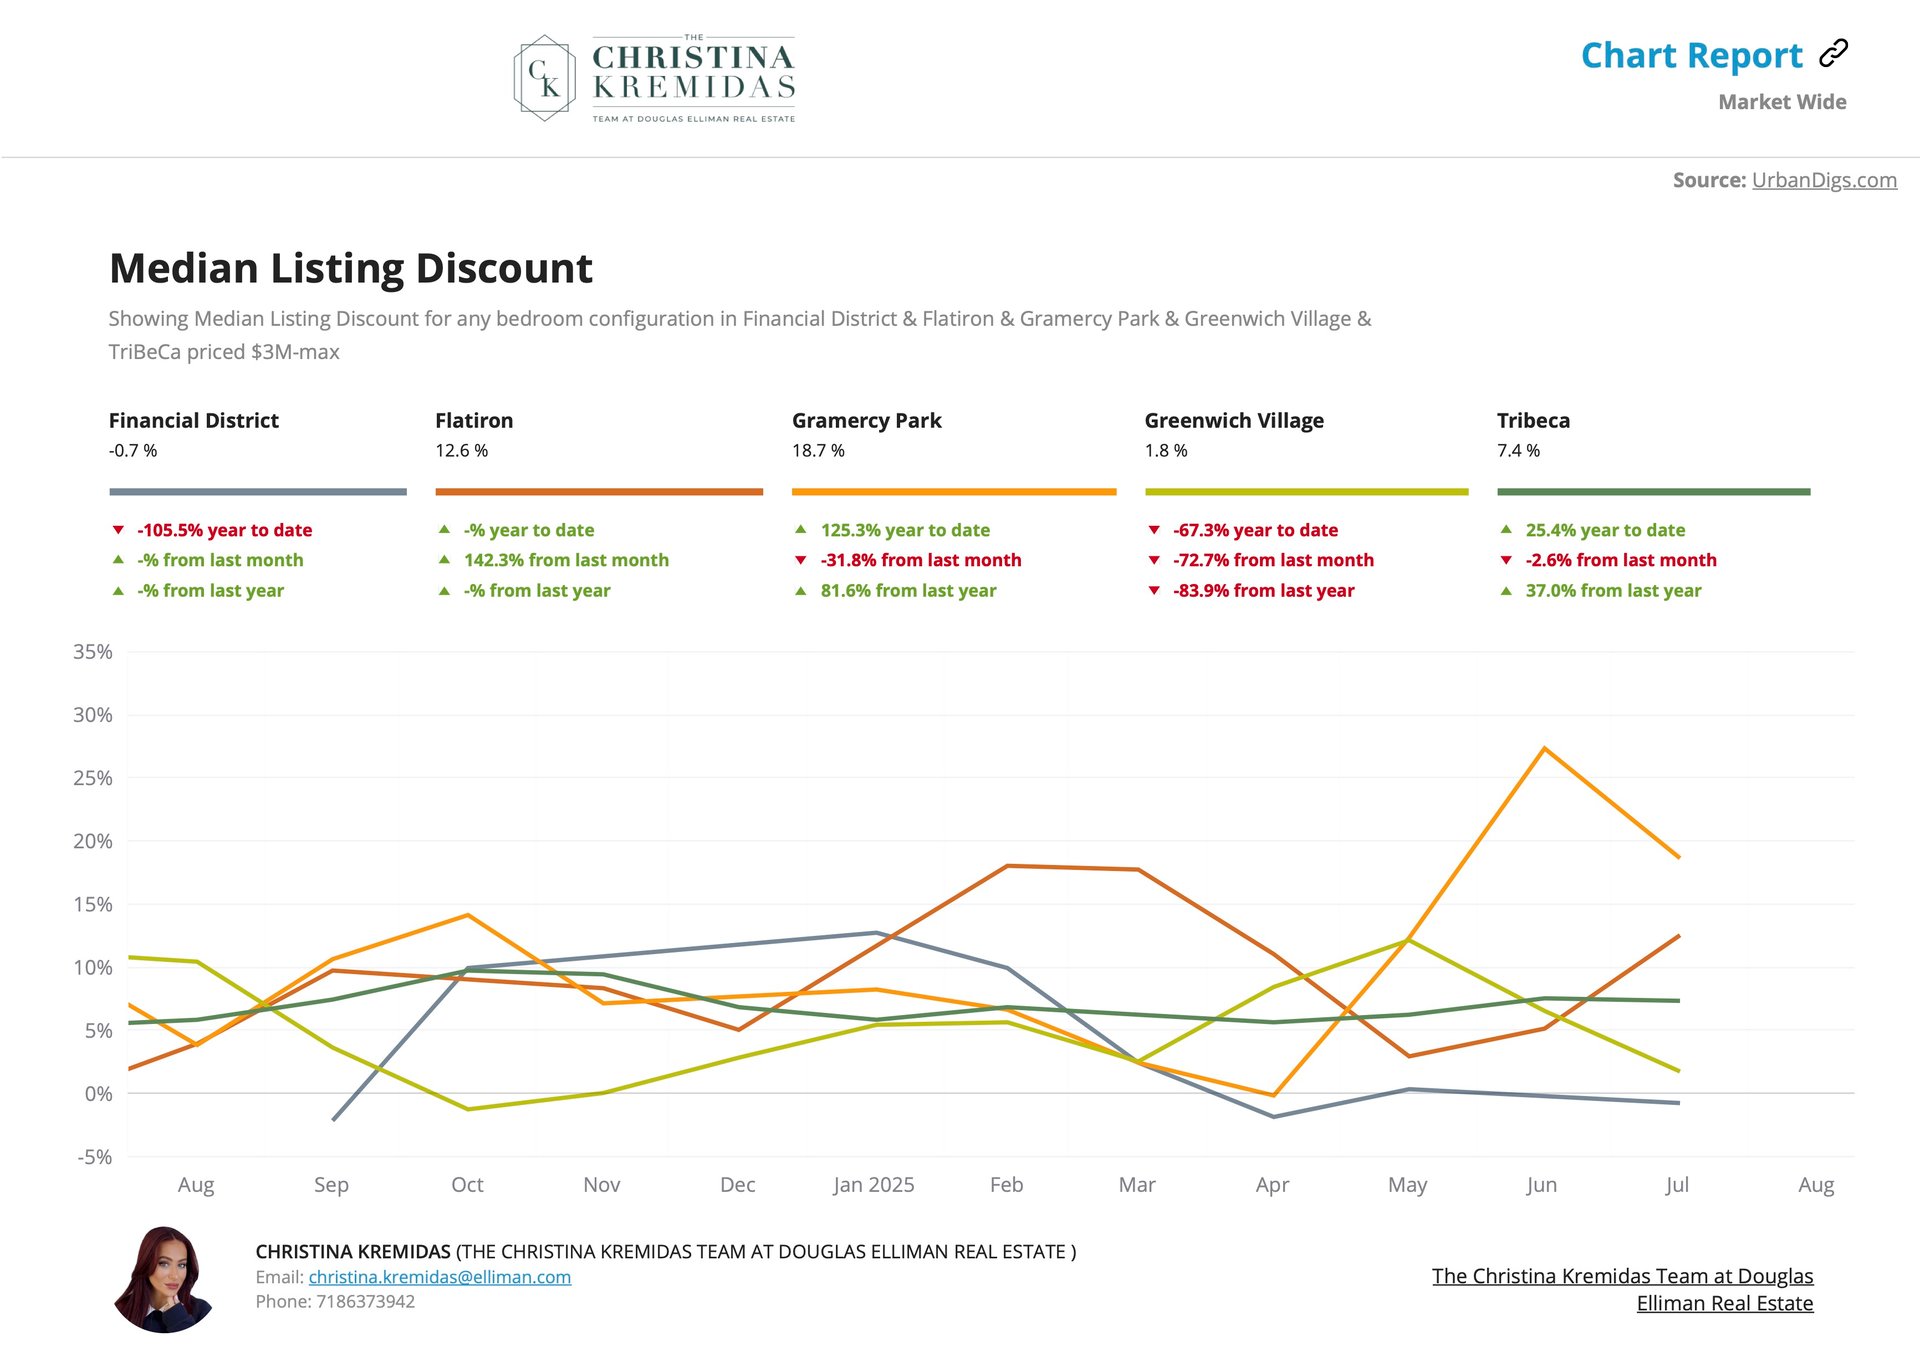
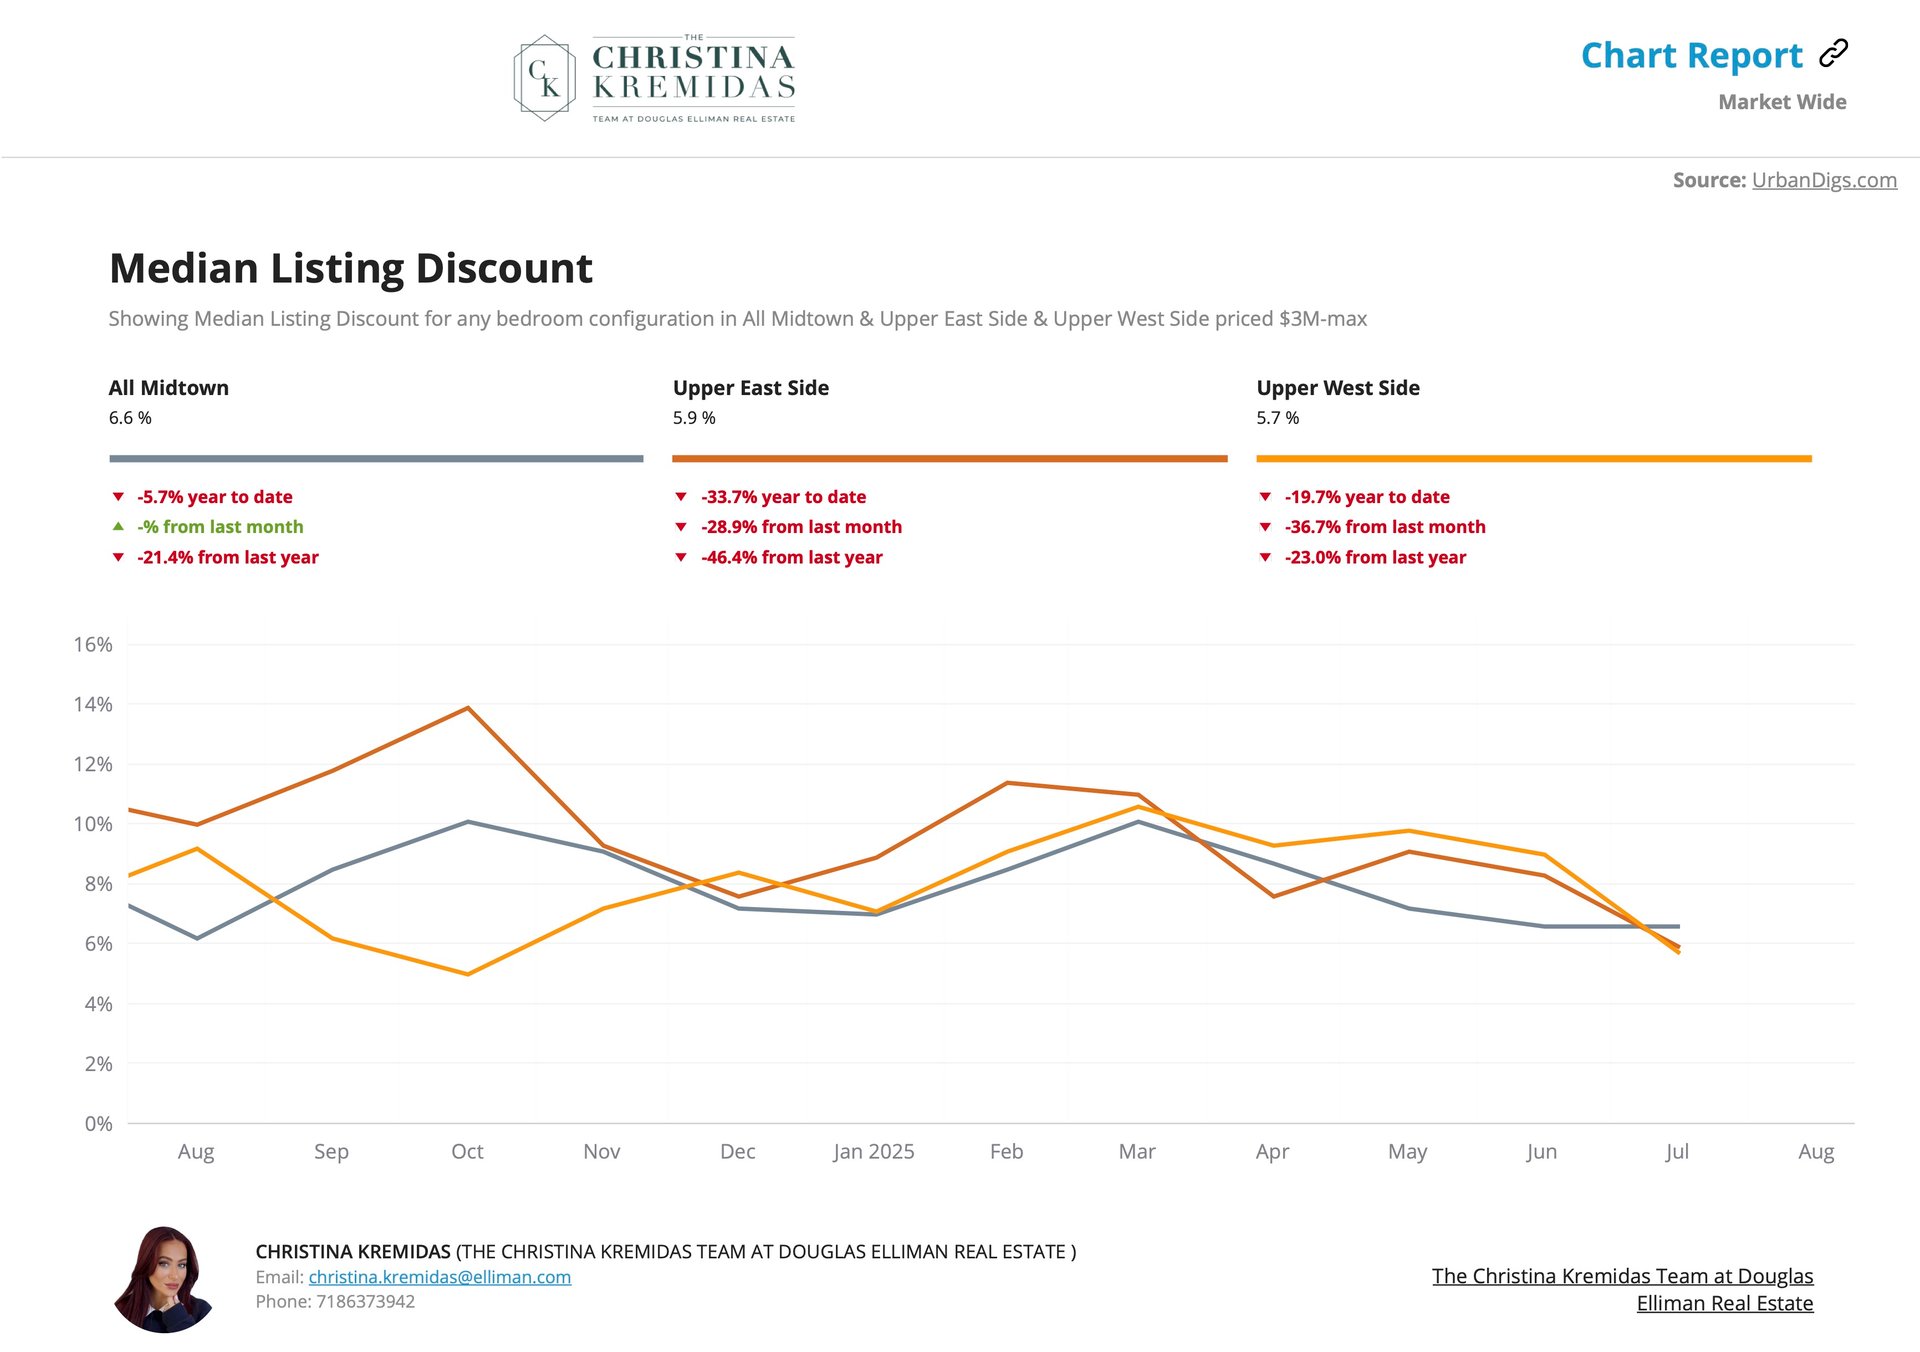
Median listing discounts in Midtown and Uptown second the prior chart, as prices increased, discount rates decreased! The average discount rate is hovering around 6% this year, which is a significant decrease from the discount rates we were seeing earlier this year and last year. However, it’s important to note that during markets like the one we’ve had last year and this year, sophisticated real estate brokers list properties much closer to true market value, with less of a markup/ padding for negotiation than we see in more competitive markets. There is simply less room between the property’s asking price and the Seller’s bottom line. To put today’s discount rate into perspective $300,000 off of a $5M purchase really isn’t too shabby. And if we are negotiating on a new dev, there is potential to save even more.
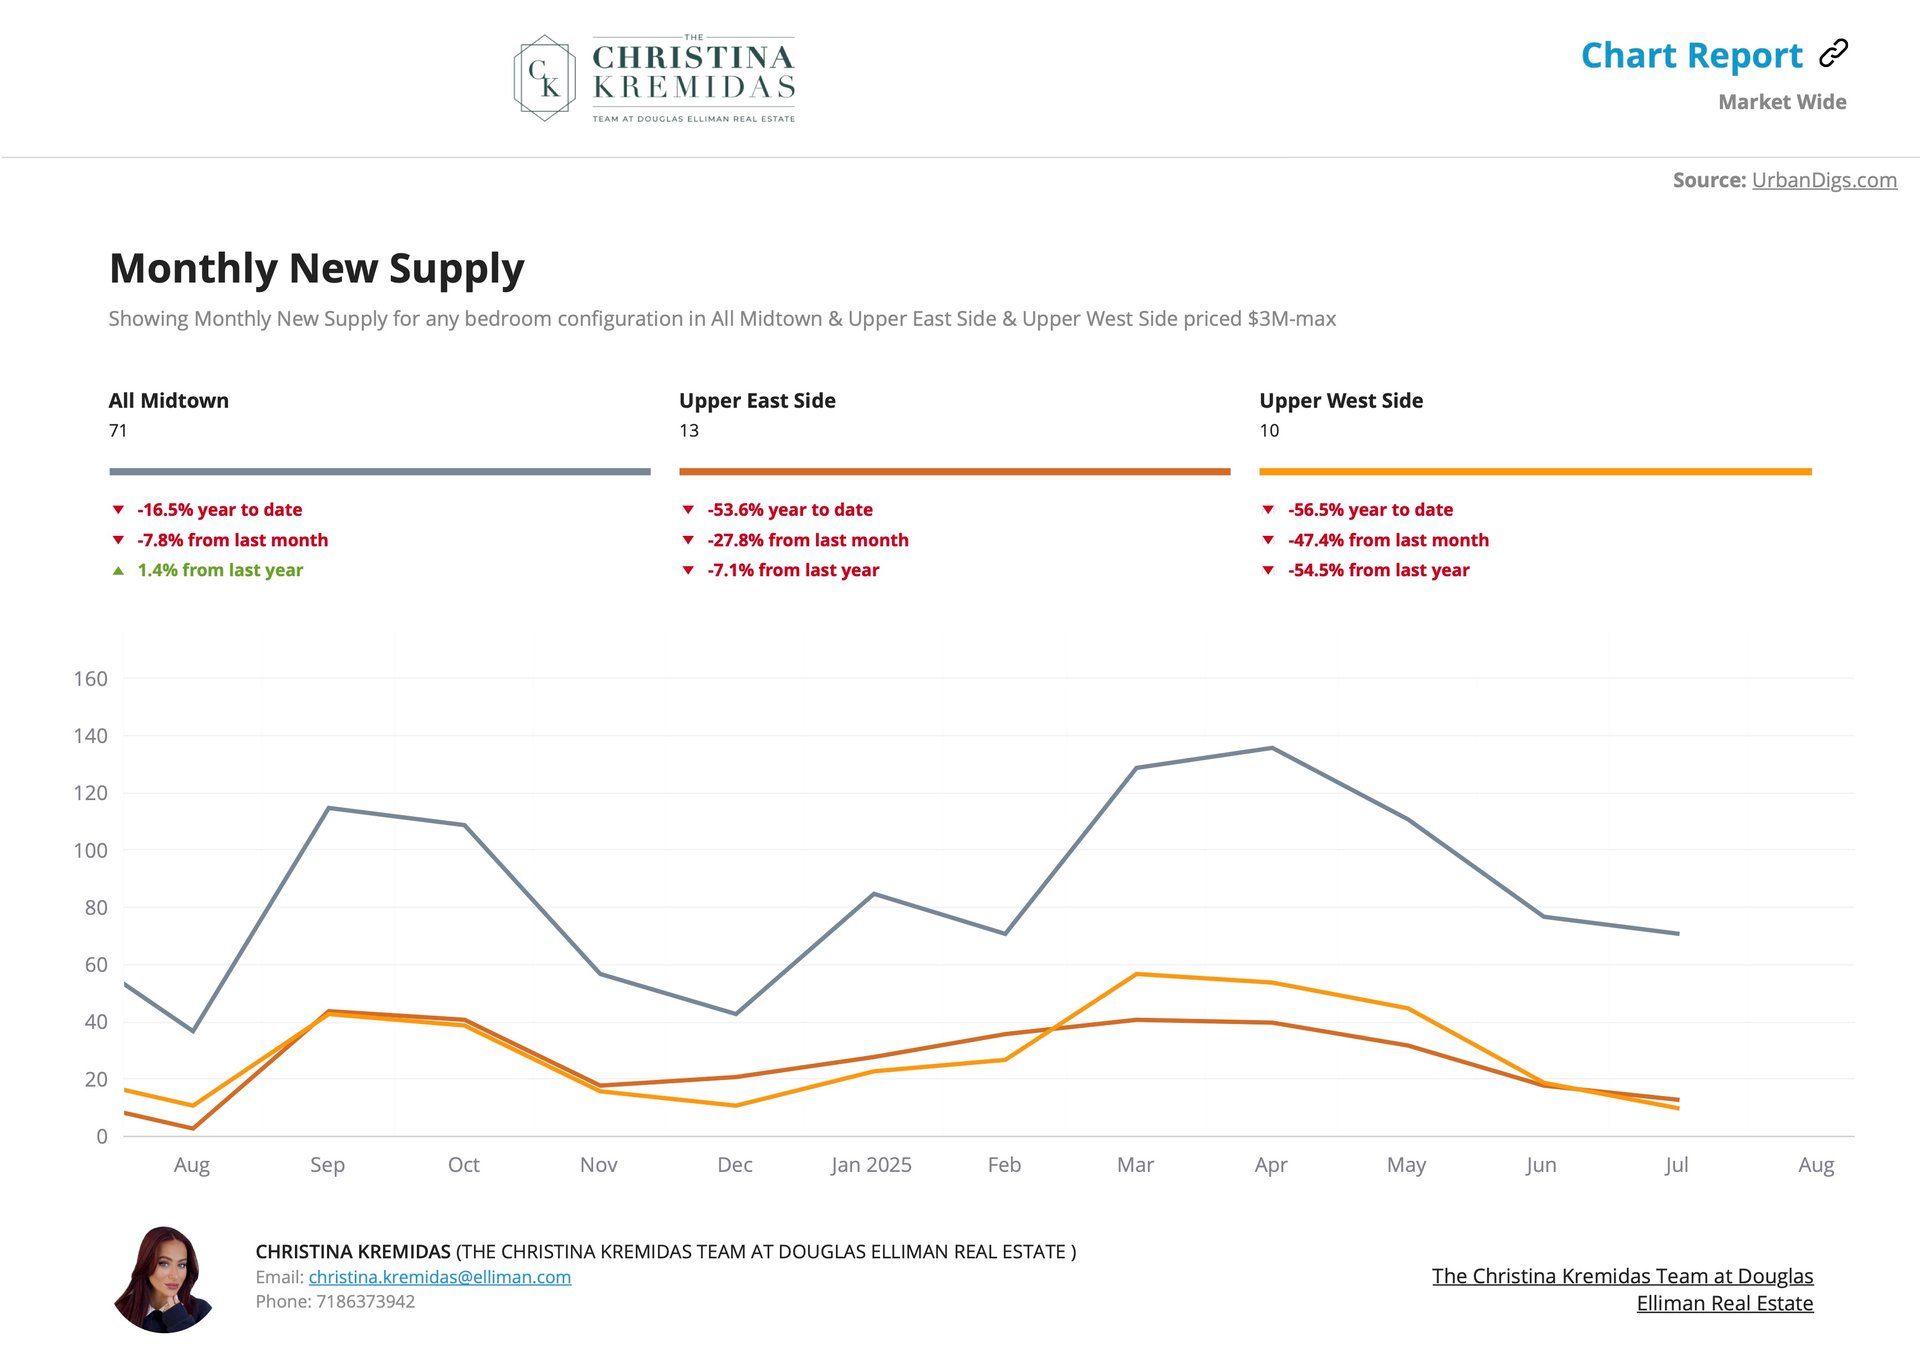
As you saw in our final chart, listing inventory Uptown and Midtown was significantly lower than last year and earlier this year. Midtown was the only area to experience a very small increase YoY in this metric. Even still, this hasn’t been enough to offset the demand in these areas. I do anticipate a shift (for the better) in this inventory shortage as we approach the Fall season. The major takeaway for listings has been to price true-to-market. Correctly priced properties are quickly absorbed, while listings that begin overpriced go stale and take much longer to offload.
In conclusion, transacting and winning in a challenging market is always doable. Often times, it is during markets like this that your greatest wealth can be earned (but you already know that). From conversations with my clients and the several listings I have in the pipeline, I feel that our inventory will be alleviated this Fall season and that my buyers will finally have great listings to view.
In the meantime, if you are looking to secure an investment property before the end of the year, I recommend taking a look in the areas that are currently experiencing high discount rates, while they last (I’ll match these ‘hoods up against highest CAP Rate (rental income vs expenses) areas for you, and the intersection becomes our target search zone.
I have the feeling that many of my clients will be jumping back in this September to put a bow on their 2025 end-of-year investment plans. If this is you, I'm looking forward to your call with all of the market knowledge and luxury specialization that you have come to appreciate. If you ever have thoughts, comments or feedback on this luxury report, please reply here and let me know. This is crafted specifically for you, and I’d like to let it evolve with more data points that you find useful. I hope that the rest of your year is fruitful and fulfilling!